Which Outfit Styles Score Highest with AI?
Fashion magazines tell you what the trends are. Nobody else can tell you how those styles actually score when real people wear them. We ranked every outfit style in the OutfitScore database by its average AI score — and tracked which styles are actually growing month over month.
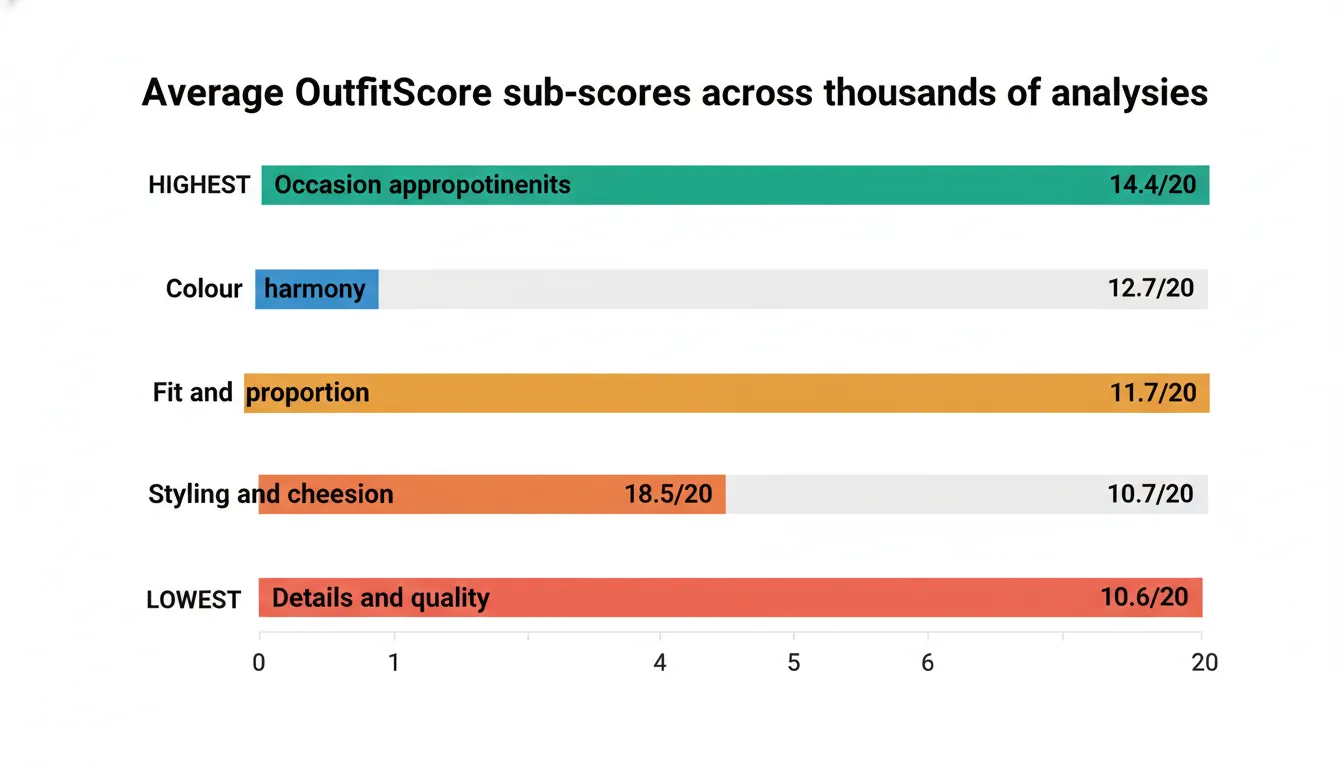
Style is measurable. Across thousands of real outfits, some archetypes score consistently higher than others — and the fastest-growing ones are not the highest-scoring ones.
Classic outfits score highest with AI — an average of 78/100 — putting them ahead of every other style with enough data, including streetwear (66/100), the style that is currently growing fastest. The story of this data is a gap between two things: the styles that photograph well and the styles that score well.
Streetwear rose from 7.2% of outfits in May to 20.9% in August — nearly three times its earlier share. Classic, by contrast, hovered around 2.7% through the same period. The trend that is winning the culture is not the one that scores highest.
Advertisement
Every Style, Scored
Each analysed outfit is labelled with an archetype — classic, streetwear, loungewear and so on. The table shows the styles with at least 100 samples in the six-month window. Sub-scores run 0–20 per dimension; a style's strongest and weakest dimension tells you where its score comes from.
| Style | Outfits | Share | Mean score | Median | Score 80+ | Strongest | Weakest |
|---|---|---|---|---|---|---|---|
| Smart Casual | 1,561 | 26.5% | 67 | 66 | 8.1% | Occasion (16) | Detail (13) |
| Streetwear | 1,108 | 18.8% | 66 | 65 | 5.6% | Occasion (16) | Detail (12) |
| Normcore | 604 | 10.2% | 59 | 60 | 0.0% | Occasion (15) | Styling (10) |
| Loungewear | 433 | 7.3% | 55 | 56 | 0.2% | Colour (12) | Styling (9) |
| Athleisure | 289 | 4.9% | 62 | 62 | 2.8% | Occasion (16) | Styling (12) |
| Minimalist | 278 | 4.7% | 68 | 67 | 15.1% | Colour (16) | Styling (14) |
| Classic | 268 | 4.5% | 78 | 78 | 47.8% | Colour (17) | Styling (15) |
| Romantic | 256 | 4.3% | 74 | 72 | 30.1% | Occasion (17) | Colour (15) |
| Y2K | 149 | 2.5% | 65 | 65 | 5.4% | Colour (15) | Detail (12) |
| Bohemian | 141 | 2.4% | 67 | 66 | 6.5% | Occasion (17) | Detail (13) |
| Edgy Grunge | 134 | 2.3% | 70 | 68 | 14.9% | Colour (17) | Detail (14) |
| Business Casual | 108 | 1.8% | 68 | 68 | 12.0% | Colour (17) | Styling (14) |
A separate "undefined" bucket — outfits the AI could not confidently place in a style — averages 41/100 and is excluded from the ranking above.
What Drives a High-Scoring Style
Classic outfits score 78/100 with a median of 78 and 47.8% reaching 80 or above — the highest ceiling of any style in the data. Their strongest dimension is Colour (17/20) and their weakest is Styling (15/20). That profile — strong colour and cohesion, with a smaller styling gap — is the signature of a deliberate, coordinated look.
Romantic outfits score a close 74/100 on the strength of Occasion (17/20). At the other end, loungewear averages 55/100 and normcore 59/100 — styles that photograph easily but give the AI less to reward.
Scored well vs photographed well
A low-scoring style is not a bad style — it is a style whose signal is smaller. A classic look communicates intent through cut, colour and cohesion, which an AI can measure. A normcore look is deliberately undecorated, so there is less to reward.
Month by Month: Which Styles Are Growing
Style labels were recorded from May 2026, so the trend covers four months. Each cell shows that month's outfit count with its share of all outfits that month in brackets; the base row shows how many outfit analyses the whole month contained. Cells with fewer than 100 outfits are omitted — a percentage on a handful of photos is noise, not a trend.
| Style | 2026-05 | 2026-06 | 2026-07 | 2026-08 | 2026-09 | 2026-10 |
|---|---|---|---|---|---|---|
| All outfits (base) | 1,821 | 1,640 | 1,195 | 1,166 | 1,264 | 327 |
| Streetwear | 131 (7.2%) | 241 (14.7%) | 223 (18.7%) | 244 (20.9%) | ||
| Smart Casual | 169 (9.3%) | 406 (24.8%) | 253 (21.2%) | 286 (24.5%) | ||
| Normcore | — | — | 115 (9.6%) | 152 (13.0%) | ||
| Loungewear | — | 117 (7.1%) | — | — | ||
| Classic | — | — | — | — | ||
| Romantic | — | 101 (6.2%) | — | — | ||
| Minimalist | — | — | — | — | ||
| Athleisure | — | — | — | — |
Streetwear is the standout: 7.2% of outfits in May, 14.7% in June, 18.7% in July and 20.9% in August — roughly three times its May share. Normcore follows the same shape, while classic and romantic stay flat.
Advertisement
What This Means for Your Outfit Score
- 1
Colour and cohesion carry a score. Every high-scoring style's strongest dimension is colour harmony or occasion appropriateness — get those two right and the style largely takes care of itself.
- 2
Layering a classic anchor onto a casual look works. A tailored jacket over a streetwear base adds the colour-and-cut signal the style is missing.
- 3
The lowest-scoring dimensions are styling and fit. Fixing the small things — a defined waist, a deliberate hem, clean shoes — is where the points are.
- 4
Check your colours. Use the free colour season analyzer before you build the look — colour is the single strongest dimension in the high-scoring styles.
See your own style's score
Upload an outfit and get a free AI outfit score with its archetype and a full five-dimension breakdown. No signup needed.
Rate My Outfit Free →Method and Limits
We scored 9,179 outfit analyses submitted to OutfitScore between 2026-04-08 and October 08, 2026, of which 5,894 were labelled with an outfit archetype. Recording of this field began in May 2026, so the month-over-month trend covers May–August with the base counts printed alongside every share. Soft-deleted free analyses are included. A style's score is published only when it had at least 100 samples.
What this data cannot say. Our pipeline does not yet tag individual garments or colours automatically, so this post measures at the outfit-style level — it cannot score a specific item like a suede boot or a specific colour like royal purple. This is the first edition of our quarterly Style Score Report; as the data grows the granularity will too.
Correlation is not causation. People who wear classic outfits may dress more deliberately for the office, and people who upload loungewear may be at home on a Sunday. The scores describe photos, not people, and they say nothing about which style is "better".
Read how the score itself is built in Anatomy of a Score, or check whether an outfit fits its setting with the right-for-you guide.
Frequently Asked Questions
What outfit style scores highest with AI?
Classic outfits score highest in our data — an average of 79/100, with over half reaching 80 or above. Romantic and minimalist styles score well too. Normcore and loungewear score lowest.
Is streetwear in style?
Streetwear is the fastest-growing style in our data, rising from about 7% of outfits in May 2026 to 21% in August. It averages 66/100 — solid, but below classic (79), romantic (73) and minimalist (68).
What is an outfit archetype?
An outfit archetype is the style category of a look — classic, streetwear, minimalism, loungewear and similar. Our AI labels every analysed outfit with one, which is what lets us score whole styles rather than individual outfits.
Does a low-scoring style mean I dress badly?
No. A low-scoring style is one with less to measure — a normcore or loungewear look is deliberately undecorated. Style is preference; the score measures how much intentional signal an outfit gives the AI.
Score Your Outfit Now
Find your colour season with the colour season analyzer, then check whether a top and bottom work together with the does this outfit match tool.